.png)

Week in Numbers: Tracking India’s Economic Pulse
India’s external indicators worsened, with the trade and current account deficits widening. WPI and PPI pointed to elevated price pressures even as consumption remained buoyant.

Datametricx is a veteran journalist tallying the macro game, keeping score of the numbers that shape India’s economy and policy.
August 15, 2026 at 1:39 PM IST
India’s retail inflation, based on the Consumer Price Index (Combined), rose to a 19-month high of 4.45% in July, primarily due to higher food prices. Retail inflation was 4.38% in June and 1.62% a year earlier. Food inflation rose to 5.52% in July from 5.32% a month earlier.
The CPI rose 0.9% month-on-month, driven by a 2.1% rise in the food price index.
Within the CPI basket, inflation was 14.77% in personal care, social protection and miscellaneous goods and services, led by a 109.84% year-on-year increase in silver jewellery prices and a 32.98% rise in gold jewellery prices.
The rise in food inflation was driven by vegetables, which rose 5.9% month-on-month in July as prices of garlic, peas, cauliflower and onion increased 14-26% sequentially.
Core inflation fell to 3.9% in July from 4.1% in June, suggesting demand pressures remain limited. However, the southwest monsoon remains deficient. Given the deficient monsoon and continued tensions in West Asia, there is an increasing risk that food and energy inflation will remain elevated in the coming months.
India’s annual inflation rate, based on the Wholesale Price Index, eased to 9.78% in July from 9.87% a month earlier. The moderation was mainly due to a fall in wholesale prices of mineral oils and crude petroleum and natural gas during the month. Despite the decline, prices of mineral oils and crude petroleum and natural gas remained elevated, with inflation in these categories at 32.40% and 26.99%, respectively.
Among the three broad groups, annual inflation was 8.52% in primary articles, 20.05% in fuel and power, and 8.29% in manufactured products.
WPI inflation remains significantly higher than CPI inflation, partly because the increase in petroleum product prices has not been fully passed through to consumers. Lower retail inflation may also reflect manufacturers’ inability to fully pass higher commodity costs on to consumers.
India’s annual inflation rate, based on the newly introduced Output Producer Price Index, remained unchanged from the previous month at 9.57% in July. Output PPI inflation has closely tracked WPI inflation in recent months. Over the last 28 months, the average difference between the two measures has been just 0.06 percentage points.
The WPI measures changes in the prices of goods traded in the wholesale market, while the PPI measures prices received by producers for goods and services.
India’s merchandise trade deficit widened to a six-month high of $31.98 billion in July from $30.42 billion in June and $27.88 billion a year earlier. Imports rose 17.5% year-on-year to $76.22 billion, while exports increased 19.6% to $44.24 billion.
Import growth was driven by crude and petroleum products and electronic goods. Imports of electronic goods increased 46.0% to $14.37 billion, while crude oil and petroleum products rose 17.6% to $18.31 billion. Export growth in July was driven primarily by petroleum products, electronic goods, and engineering goods. Exports of petroleum products rose 67.6% to $6.92 billion, while electronic goods exports increased 57.4% to $5.92 billion. Engineering goods rose 17.7% to $12.24 billion.
Gold imports grew by just 4.8% following the government’s sharp increase in import duty on the precious metal.
Growth in automobile dispatches accelerated in July, driven by increases across all segments. Total automobile dispatches rose 25.0% year-on-year to 2.47 million units, posting double-digit gains for the ninth consecutive month.
Passenger vehicle dispatch growth increased to a multi-year high of 34.3%, with dispatches rising to 457,810 units in July. In absolute terms, this was the second-highest monthly passenger vehicle dispatch figure. Two-wheeler dispatches rose 22.6% to 1.92 million units, while three-wheeler dispatches increased 33.4% to 92,560 units. The growth in automobile dispatches came despite a hike in automobile prices and higher petrol and diesel prices,
Within the passenger vehicle segment, utility vehicle dispatches rose 29.2% to 248,895 units, while car dispatches increased 37.6% to 132,408 vehicles. Within the two-wheeler segment, motorcycle dispatches rose 20.7% to 1.07 million units, while scooter dispatches increased 23.7% to 798,190 units.
Automobile production rose 24.8% year-on-year to a record 3.37 million units in July, suggesting manufacturers are preparing for robust demand in the coming months.
Growth in domestic tractor sales accelerated to a three-month high of 20.5% year-on-year in July from 11.9% in June. Month-on-month, tractor sales declined 38.5% to 77,482 units in July. Tractor sales typically peak in June and fall in July. The tractor industry, among the biggest beneficiaries of the GST rate cuts implemented in September 2025, has recorded double-digit growth in domestic sales for the past year. Total sales, including exports, rose 18.5% to 86,262 units, while production increased 10.2% to 114,595 units in July.
India’s current account deficit widened to $6.2 billion in June from $2.0 billion a month earlier, mainly due to a wider merchandise trade deficit and a lower services trade surplus. The current account recorded a surplus of $1.2 billion in June last year.
The capital account recorded a surplus of $9.1 billion in June, pushing the overall balance of payments to a surplus of $2.9 billion. The capital account was in a deficit of $2.4 billion a month earlier and $1.6 billion a year ago. The surplus was mainly due to a sharp rise in banking-sector flows following inflows into the Foreign Currency Non-Resident (Bank) account.
The current account recorded a deficit of $3.1 billion in the April-June quarter, up from $2.9 billion a year ago. The capital account recorded a deficit of $5.0 billion in the first quarter of 2026-27, compared with a surplus of $7.4 billion a year ago.
With the FCNR (B) deposits rising sharply in July and August following the hedging window provided by the Reserve Bank of India, the capital account is expected to move into surplus in the second quarter of 2026-27.
Open-ended mutual fund schemes saw net inflows of ₹2.366 trillion in July, the fourth highest inflow on record, driven by a sharp jump in inflows into debt schemes. Mutual fund schemes saw outflows of ₹501 billion in June and inflows of ₹1.789 trillion in July last year. Debt schemes saw inflows of ₹1.875 trillion in July, compared with outflows of ₹1.091 trillion a month earlier.
Inflows into equity schemes declined to ₹247 billion in July from ₹290 billion a month earlier. Inflows into equity mutual funds have remained positive for more than five years now. Flows into gold exchange-traded funds slowed to ₹16 billion in July from ₹34 billion a month earlier.
Systematic investment plan inflows remained robust despite stock market volatility. SIP inflows were ₹320 billion in July, marginally higher than ₹318 billion a month earlier. The number of SIP accounts rose to 106.3 million from 97.8 million a month earlier. The mutual fund industry’s net assets under management were at ₹85.756 trillion at the end of July, up from ₹82.225 trillion a month earlier.
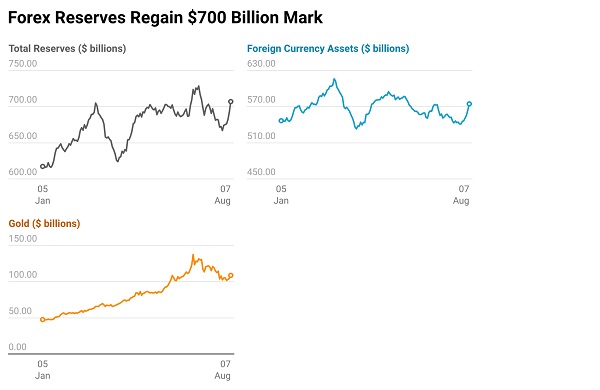
India’s foreign exchange reserves rose to a 21-week high, with inflows following the Reserve Bank of India’s measures to attract foreign currency boosting reserves and higher gold prices increasing the value of gold holdings. Total foreign exchange reserves increased by $14.14 billion to $707.00 billion in the week ended August 7. Foreign currency assets rose by $9.95 billion to $574.63 billion, while gold reserves increased by $4.00 billion to $108.74 billion. As of August 13, the RBI measures had attracted inflows of $56.85 billion.
Reservoir storage increased sharply in the latest week but remained below historical trends. As of August 13, live storage in reservoirs stood at 109.11 billion cubic metres, up 12.1 billion cubic metres from a week earlier. This was the second-largest weekly increase in the past year. Live storage was at 59% of total reservoir capacity. However, storage was 20% below last year’s level and 2% lower than the 10-year average. Reservoirs are replenished during the southwest monsoon.
Southwest monsoon rainfall remained deficient. As of August 14, cumulative rainfall over the country was 498.9 millimetres, or 87% of the long-period average. Among the four regions, rainfall was 73% of the long-period average over east and northeast India, 80% in the south peninsula, 89% in northwest India, and 99% in central India.
Rainfall was 63% of the long-period average in June, 101% in July, and 87% of the long-period average through August 14.
Kharif sowing remained below last year’s level amid a deficient southwest monsoon. The total area sown under kharif crops fell 2.0% year-on-year to 101.66 million hectares as of August 14. Rice area, which typically accounts for about one-third of total kharif sowing, declined 3.7% to 37.91 million hectares. The area under pulses fell 0.3% to 10.81 million hectares, while oilseed acreage declined 0.5% to 18.45 million hectares. Sugarcane sowing declined 0.5% to 5.83 million hectares, while cotton area declined 0.9% to 10.73 million hectares. The area sown so far accounted for 93% of the normal kharif area of 110.45 million hectares.
Rice and wheat stocks with the government were at near-record levels as of August 1, providing a cushion against a possible decline in foodgrain production due to the weak southwest monsoon. Total foodgrain stocks, including unmilled paddy, stood at 114.41 million tonnes, the third-highest level on record. Rice stocks were at 40.20 million tonnes, the second-highest level on record, while wheat stocks stood at 50.53 million tonnes, the highest level for August 1 level in five years. The government held 35.35 million tonnes of unmilled paddy, equivalent to about 23.68 million tonnes of rice.
Coming up
- August 17: Periodic Labour Force Survey for July
- August 20: Index of Nine Core Industries for July
- August 21: HSC India Flash PMI for August
Tailpiece
Notwithstanding trade tensions, the US remained India’s largest export market by far. India exported goods worth $34.49 billion in April-July, accounting for nearly 20% of total merchandise exports.
More From BasisPoint