.png)


Dhananjay Sinha, CEO and Co-Head of Institutional Equities at Systematix Group, has over 25 years of experience in macroeconomics, strategy, and equity research. A prolific writer, Dhananjay is known for his data-driven views on markets, sectors, and cycles.
September 1, 2026 at 2:14 PM IST
India’s 7.8% real GDP growth in April–June 2026 is unquestionably a strong start to 2026–27. It exceeded the Reserve Bank of India’s 7.0% projection, improved from 6.9% a year earlier and was broad-based in the headline data. Gross value added rose 8.2%, services expanded close to 10%, manufacturing grew 9.2%, private consumption increased 7.1%, and gross fixed capital formation rose 10.1%.
The figures increase the likelihood that full-year growth could be close to 7%. They do not, however, establish that a self-sustaining private income and investment cycle has taken hold.
That distinction is key because the economy entered the quarter with substantial fiscal and monetary support. Over the preceding year, GST and income-tax rationalisation, 125 basis points of policy rate cuts, liquidity infusion estimated at ₹14 trillion–₹15 trillion and broader regulatory easing had all improved financial conditions or supported demand. The acceleration in GDP growth from 6.9% to 7.8% is consistent with that support having worked. The more difficult question is whether the improvement was commensurate with the scale of the intervention, and whether it has begun to generate its own momentum.
Policy Returns
This cannot be read as a pure measure of demand. Tax-rate changes and higher subsidies mechanically affect net indirect taxes. It does, however, show that part of the support to activity has come with a fiscal cost, while tax buoyancy has yet to confirm an equally broad rise in nominal transactions and incomes.
The demand composition points in the same direction. Real private consumption grew 7.1%, but its share of nominal GDP fell to 55.6% from 58.1% a year earlier. Government consumption’s share rose to 11.1% from 9.5%. Gross fixed capital formation was strong, but the available evidence suggests that much of the acceleration came from the Centre. Central government expenditure rose 11% to ₹13.5 trillion, capital expenditure increased 24%, and non-interest revenue expenditure grew 19.5%.
Public capex can expand capacity and crowd in private investment. The issue is that the crowding-in stage remains difficult to identify in the quarterly data. Until private investment broadens beyond sectors linked directly to public spending, the investment surge is better interpreted as policy activation than as an autonomous capex cycle.
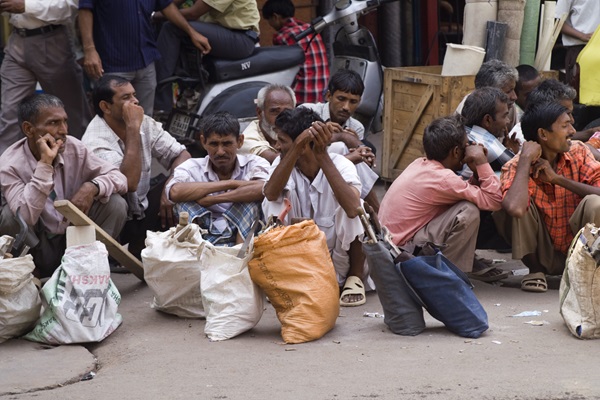
Household indicators reinforce that caution. Systematix Research’s household tracker shows the urban net employment perception balance at -22%, the weakest level outside the pandemic in more than a decade. Around 75–76% of urban households reported stagnant or worsening incomes. Rural wage growth of about 4.2% remained below rural inflation, while urban households’ inflation perceptions were well above measured consumer inflation.
These are survey and perception indicators, not substitutes for the national accounts. They nevertheless matter for durability. Consumption financed by rising incomes can sustain itself; consumption supported by tax relief, credit or the spending of higher-income households is more vulnerable when the policy impulse fades. Strong sales in selected vehicle and premium categories can therefore coexist with pressure on mass-market demand.
The sectoral pattern is similarly uneven. Services grew close to 10% and their share of nominal GVA reached 55.7%. Financial, real estate and information-technology-related activities alone accounted for 27.1%. Manufacturing’s nominal share, by contrast, fell to 12.9%, a multi-decade low, even though its reported real growth was 9.2%.
A growing services economy is not intrinsically a problem. India’s services base is an important source of productivity, exports and income. But when incremental growth is concentrated in finance, real estate and technology, its employment transmission may be narrower than that of construction or labour-intensive manufacturing. The decline in manufacturing’s nominal share therefore raises questions about the economy’s ability to create enough quality jobs and sustain a broad private investment cycle.
The external account provides another warning about transmission. Nominal exports of goods and services grew 25.8%, but imports rose 30.9%. Net exports consequently widened to -2.7% of GDP from -1.4% a year earlier. Higher crude and commodity prices explain part of the increase, but the pattern is also consistent with demand that is relatively import-intensive. In that case, some of the domestic stimulus leaks into imports rather than becoming domestic income and employment.
Price Effects
The GDP deflator adds a measurement issue to this composition problem. Nominal GDP growth of 10.3% and real growth of 7.8% imply an economy-wide deflator of about 2.5%. That compares with average CPI inflation of about 3.9%, WPI inflation of 9.4% and PPI inflation of 9.2% during the quarter. The private-consumption deflator was 2.8%, while the manufacturing deflator was -1.5%.
The GDP deflator is not a weighted average of CPI and WPI, and the double-deflation method can produce outcomes that appear counter-intuitive, especially when output and input prices move differently. A low deflator therefore does not, by itself, invalidate the official estimate. It does mean that the strength of reported real growth depends materially on price adjustments that deserve fuller explanation.
A sensitivity exercise using a 6% deflator would place real GDP growth closer to 4.3%. That is not an alternative estimate of growth, because selecting a counterfactual deflator is not the same as constructing one from sector-level output and input prices. It shows, however, how much the interpretation of the quarter changes with the price measure. Greater disclosure of sectoral deflators, weights and the impact of double deflation would improve confidence in the headline number.
The policy conclusion is not that India’s economy is weak, nor that the 7.8% estimate should be dismissed. It is that aggregate growth remains more dependent on public expenditure, policy support and unusually low deflators than the headline alone suggests.
That creates an awkward choice. The strong GDP number weakens the case for another round of generalised stimulus. Yet soft household incomes, weak employment perceptions and the limited evidence of broad private capex argue against complacency. Further undifferentiated support could add to inflation, leverage and imports without repairing the channels through which growth reaches incomes and jobs.
The next phase of policy should therefore be judged less by the size of the impulse and more by its transmission. Public investment must crowd in private capex, manufacturing must raise its share of value added, and employment and real wages must begin to confirm the strength visible in aggregate output.
The 7.8% print is evidence that policy support is sustaining growth. The next test is whether incomes, employment and private investment can sustain it when that support begins to recede.
More From BasisPoint