.png)


Datametricx is a veteran journalist tallying the macro game, keeping score of the numbers that shape India’s economy and policy.
September 6, 2026 at 6:29 AM IST
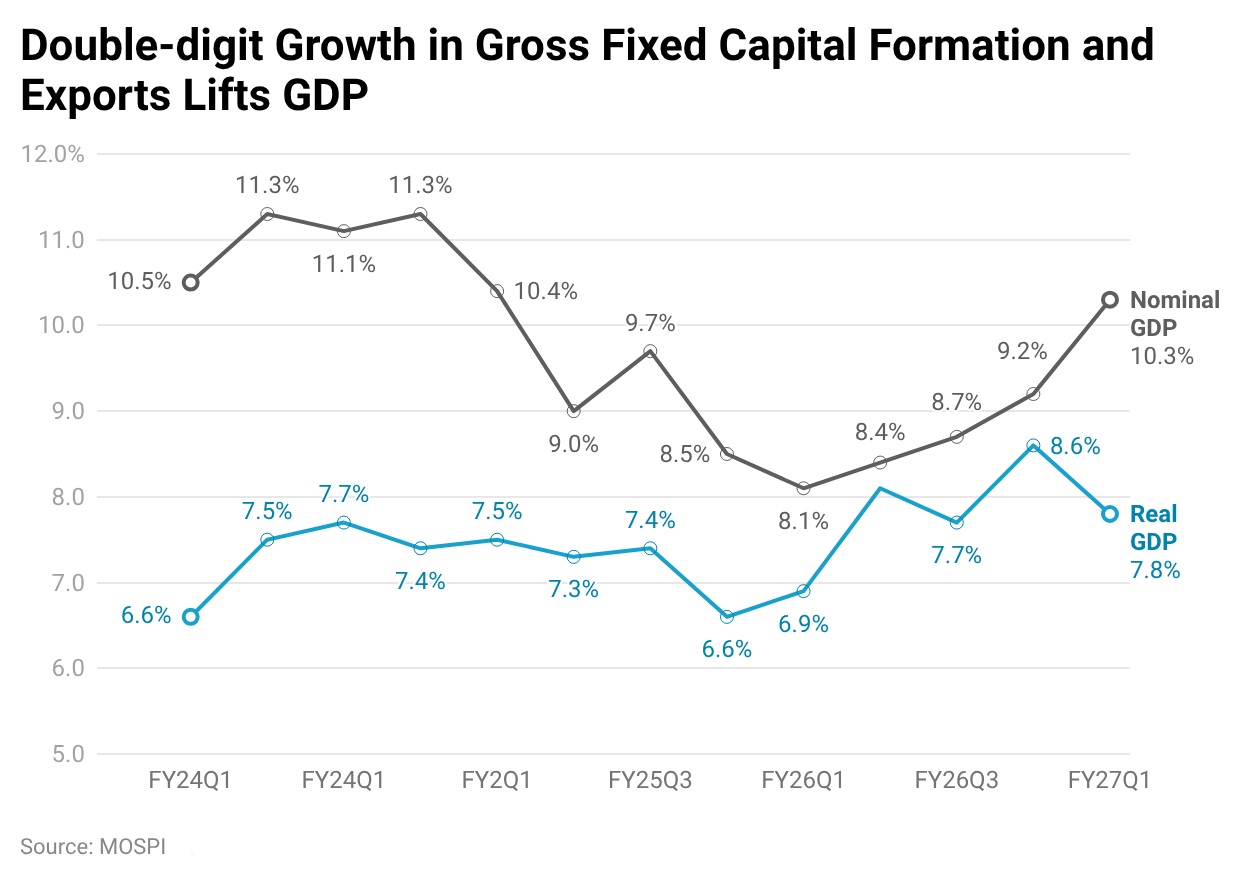
India’s GDP grew 7.8% in April-June, sharply higher than the consensus estimate of around 7.2%, led by double-digit growth in gross fixed capital formation and exports. GDP grew 8.6% in the previous quarter and 6.9% a year ago. Gross fixed capital formation rose 11.9% in April-June, the fastest pace in the current series, while exports rose 12.0%. Private consumption expenditure growth rose to 7.1%, while government consumption expenditure growth moderated to a nine-quarter low of 4.3%.
Gross value added grew 8.2%, faster than GDP, mainly because of the sharp growth in subsidies and slower growth in tax collections. Within GVA, services grew by 10.0% in April-June compared with 7.7% in industry and 3.6% in agriculture.
Nominal GDP grew 10.3% in April-June, the fastest pace in eight quarters. The GDP deflator came in at 2.3%, surprisingly low relative to other inflation measures, including CPI, the Wholesale Price Index and Output Producer Price Index, which were sharply higher in April-June, ranging from 3.9% to 9.4%.
Activity in India’s manufacturing sector moderated sharply in August as growth in output and new orders declined. HSBC India Manufacturing Purchasing Managers’ Index fell to a five-year low of 52.8 in August from 53.5 in July. This is the third consecutive month of decline in the manufacturing PMI. The August manufacturing PMI was also below its long-run average of 54.2.
Growth in output and new orders slowed to their lowest levels in five years. The softer demand conditions led to weaker increases in buying levels and inventories. Manufacturing employment fell for the first time in two-and-a-half years, though the rate of decline was only fractional.
Indian services activity expanded at a quicker rate in August but remained below historical averages. HSBC India Services PMI rose to 54.1 in August from 53.3 in July. Despite the improvement, the services PMI in August was the second-weakest since March 2022 and was below the long-run average of 54.5. Although growth in output and sales strengthened from July, rates of expansion were still among the weakest seen in over four years.
The acceleration in services activity offset the slowdown in manufacturing and left the pace of private sector growth unchanged in August. HSBC India Composite PMI was at 54.3 in August, unchanged from a month ago, but the joint-slowest in four-and-a-half years and below the historical trend.
The Indian government’s fiscal deficit declined by 2.8% year-on -year to ₹4.55 trillion in April-July, primarily because total receipts grew faster than expenditure. The fiscal deficit at the end of four months accounted for 26.8% of the budget target of ₹16.96 trillion for the full year, compared with 29.9% in the same period of last year.
The government’s total receipts in April-July rose 19.3% year-on-year to ₹13.07 trillion, led by a 27.6% increase in net tax revenues to ₹8.45 trillion. Though total tax revenue rose only 11.4% year-on-year to ₹12.18 trillion in April-July, net tax revenue was sharply higher because tax devolution to states declined 13.1% to ₹3.72 trillion. The decline in tax devolution is likely to be reversed during the year as the government had front-loaded tax devolution last year. Within expenditure, revenue expenditure rose 7.8% to ₹13.11 trillion in April-July, while capital expenditure increased 29.9% to ₹4.51 trillion.
The government’s fiscal deficit in July declined 21.5% year-on-year to ₹1.47 trillion, primarily because of a sharp increase in tax collections during the month. Total receipts increased 67.4% to ₹2.57 trillion as net tax revenues increased 71.2% to ₹2.08 trillion. Total expenditure in July increased 18.5% to ₹4.05 trillion, led by a 53.7% increase in capital expenditure to ₹1.10 trillion.
The government’s gross tax collections rose 41.6% year-on-year to ₹3.17 trillion in July, driven primarily by direct tax collections, especially income tax. Direct tax collections rose 76.6% to ₹1.77 trillion, on the back of a 96.1% increase in income tax collections to ₹1.36 trillion. Indirect tax collections during the month increased 13.3% to ₹1.40 trillion, mainly because of a 19.2% increase in goods and services tax to ₹916 billion and a 43.0% increase in customs duty collections to ₹259 billion.
Gross tax collections in April-July rose 11.4% to ₹12.18 trillion, led by a 23.8% increase in direct tax collections to ₹7.08 trillion. Within direct taxes, income tax collections rose 24.3% to ₹4.42 trillion and corporate tax collections increased 20.8% to ₹2.40 trillion. Indirect tax collections in April-July contracted 2.1% to ₹5.10 trillion. Within indirect taxes, GST collections declined 4.8% to ₹3.57 trillion, while excise duty collections contracted 23.1% to ₹645 billion. The government had overhauled the GST structure, reducing the number of tax slabs in September last year, while it cut excise duty on petrol and diesel in March to protect consumers from a sharp rise in crude oil prices. Customs duty collections rose 38.2% to ₹836 billion in April-July.
Goods and services tax collections rose 14.8% year-on-year to ₹2.00 trillion in August. The year-on-year comparison is not strictly like-for-like because this year’s collections include a portion of the erstwhile GST compensation cess that has been subsumed into GST rates following the government’s restructuring of the indirect tax regime. Net GST collections, after refunds, rose 8.3% to ₹1.68 trillion.
India’s current account deficit widened to $4.24 billion in April-June from $3.39 billion a year ago. As a percentage of GDP, the current account deficit was 0.5% in April-June, up from 0.4% a year earlier. India had a current account surplus of $6.46 billion in January-March, accounting for 0.7% of GDP. The current account deficit widened from a year earlier in April-June, mainly because of a larger merchandise trade deficit. The merchandise trade deficit widened to $86.09 billion in April-June from $68.89 billion a year ago. Although invisibles rose sharply to $81.85 billion in April-June from $65.49 billion, they were not enough to offset the increase in the merchandise deficit.
India recorded a capital account deficit of $5.50 billion in April-June compared with a surplus of $9.27 billion a year earlier. The capital account deficit was mainly due to portfolio investment outflows of $9.56 billion in April-June, compared with inflows of $1.61 billion a year earlier. India had a balance-of-payments deficit of $8.10 billion in April-June, compared with a surplus of $4.51 billion a year ago and $7.22 billion in the previous quarter.
Electricity generation from conventional sources rose 7.8% year-on-year to 144.11 billion kWh in August, led by a sharp increase in thermal and nuclear power generation. In absolute terms, August generation was the second-highest on record. Thermal power generation increased by 11.7% to 116.81 billion kWh, while nuclear power generation increased by 22.3% to 5.02 billion kWh. Hydropower generation, however, declined by 12.0% to 20.69 billion kWh in August.
Growth in electricity generation from conventional sources has accelerated sharply in recent months, averaging 7.5% year-on-year in the last four months compared with 0.4% in the previous four months.
Growth in e-way bill generation improved marginally to 7.7% year-on-year in August from 6.0% a month earlier, but remained low by historical standards. The growth in August was the second-lowest in 46 months. In absolute terms, e-way bill generation in August was the third-highest on record at 139.09 million. An e-way bill, a GST document required for transporting goods worth more than ₹50,000, is a leading indicator of economic activity.
Growth in bank credit continued to accelerate across the board in July. Non-food bank credit rose 19.1% year-on-year as of July 31, up from 18.3% a month earlier and 9.9% a year earlier. Personal loans, which account for roughly one-third of the total non-food credit, increased by 16.2%, up from 15.8% a month earlier and 11.9% a year earlier. Credit to industry accelerated to 20.0% from 19.2% a month earlier and 6.5% a year earlier, while credit to services increased to 22.9% from 21.4% a month earlier and 6.5% a year earlier. Agricultural credit accelerated to 17.0% from 16.8% a month earlier and 7.3% a year earlier.
Bank lending rates were mixed in July, with the average lending rate on fresh rupee loans rising for foreign banks and falling for public-sector and private-sector banks. The weighted average lending rate on fresh rupee loans of scheduled commercial banks declined marginally to 8.52% in July from 8.53% a month earlier. Lending rates on fresh rupee loans of foreign banks increased by 5 basis points to 8.04% in July, while those of public-sector and private-sector banks declined by 5 basis points and 3 basis points to 7.98% and 9.09%, respectively. The weighted average rate on fresh term deposits fell by 9 basis points to 5.90%. Since the start of the monetary easing cycle in February 2025, the weighted average lending rate on fresh rupee loans has declined by 81 basis points, compared with a cumulative reduction of 125 basis points in the policy repo rate. Over the same period, the weighted average rate on fresh term deposits fell by 81 basis points.
India’s services trade surplus narrowed marginally to $17.65 billion in July from $17.89 billion a month earlier. The reduction was mainly due to faster growth in import during the month. Services imports rose 19.1% year-on-year to $20.61 billion, while services exports increased 13.4% year-on-year to $38.25 billion, the fastest growth in over a year. Including merchandise trade, the overall trade deficit in July widened to $14.33 billion from $12.53 billion a month earlier.
India’s annual inflation based on the CPI for Industrial Workers eased to 4.57% in July from a 28-month high of 4.76% a month earlier. The fall was primarily due to the statistical effect of a high base. During the month, the overall index rose 0.9% month-on-month, led by a 1.1% increase in food and beverage prices and a 1.7% increase in housing prices. By comparison, inflation based on the headline CPI (Combined) rose to a 19-month high of 4.45% in July from 4.38% a month earlier.
India’s foreign exchange reserves rose to an all-time high on the back of strong inflows following the special dollar/rupee swap facility announced by the Reserve Bank of India to attract foreign exchange. The reserves rose to a record high of $740.80 billion as of August 28, surpassing the previous high of $728.49 billion touched on February 27. As of August 31, banks raised $136.38 billion through the special swap facility.
Foreign exchange reserves rose by $23.90 billion from a week earlier, led by an $18.82 billion increase in foreign currency assets to $600.67 billion. This is the highest week-on-week increase on record in both foreign exchange reserves and foreign currency assets. Gold reserves rose by $4.99 billion to $116.41 billion, driven by higher gold prices.
Reservoir storage continued to increase but remained below historical averages. As of September 3, live storage in 178 reservoirs stood at 129.87 billion cubic metres, up 4.57 billion cubic metres from a week earlier. Live storage was at 70% of total reservoir capacity. However, storage was 18% below last year’s level and 3% below the 10-year average. Reservoirs are replenished during the southwest monsoon.
India’s southwest monsoon could be its weakest since 2015, with rainfall remaining deficient so far. As of September 4, cumulative rainfall across the country was 629.7 millimetres, or 87% of the long-period average. Among the four regions, rainfall was 74% of the long-period average over the south peninsula, 76% over east and northeast India, 91% over northwest India, and 95% over central India. Rainfall was 65% of the long-period average in June, 101% in July, and 84% in August. In 2015, southwest monsoon rainfall was 87% of the long-period average.
Kharif sowing continued to lag as the sowing season neared its end. The total area sown under kharif crops was 108.63 million hectares as of September 4, down 1.6% from a year ago. Rice acreage declined 3.7% to 42.18 million hectares. Area under oilseeds and coarse cereals fell 0.6% to 19.20 million hectares and 18.14 million hectares, respectively. However, pulse acreage rose 1.6% to 11.71 million hectares. Among cash crops, sugarcane acreage declined 0.7% to 5.85 million hectares, while cotton area fell 0.6% to 10.92 million hectares. The area sown so far accounted for 98% of the normal kharif area of 110.45 million hectares.
Coming up
- September 14: Consumer Price Index for August
- September 14: Balance of Payments for July
- September 14: Wholesale Price Index for August
- September 14: Output Producer Price Index for August
Tailpiece
Maharashtra accounted for 11.6% of the 1.27 million passenger vehicles sold in the country in April-June. In fact, during the quarter, the top six states--Maharashtra, Uttar Pradesh, Gujarat, Karnataka, Tamil Nadu, and Haryana--accounted for more than 50% of passenger vehicle sales in the country.
More From BasisPoint