India's digital payments revolution should have reduced the economy's dependence on cash. Instead, high-denomination currency continues to expand at an extraordinary pace. The RBI has described this coexistence of rapid digitalisation and rising currency in circulation as the "Currency Demand Paradox". Yet, one variable remains largely absent from the debate: India's rapidly growing imports from China.
The persistence of the Currency Demand Paradox since the early 2000s suggests that conventional currency demand models may be overlooking important structural drivers of cash demand. To examine this possibility, Table 1 compares the long-run growth of GDP, currency in circulation and imports from China. The striking asymmetry points to India's rapidly growing imports from China as a plausible missing variable.
Table 1: The Long-Run Evidence Reveal a Striking Asymmetry (FY2001–FY2026)
|
Variable
|
Growth Multiple
|
Elasticity with respect to GDP
|
|
Nominal GDP
Total Currency Supply [A+B]
|
16.4×
19.4
|
-
1.18
|
|
A] High-Denomination Notes (HDNs)
|
62.3×
|
1.48
|
|
B] Non-High-Denomination Notes
|
3.8×
|
0.48
|
|
Imports from China
|
162×
|
1.82
|
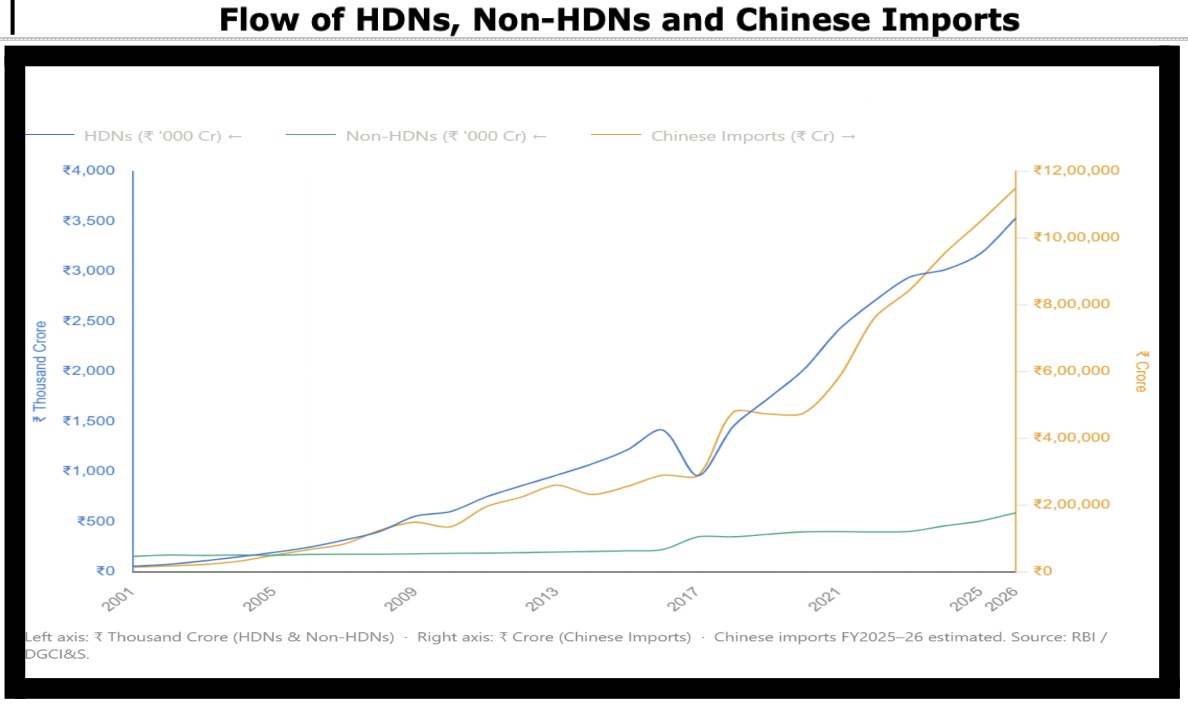
The long run evidence is striking. Between 2001 and 2026, nominal GDP expanded 16.4 times, while total currency in circulation increased 19.4 times. Almost the entire divergence came from ₹500 and above notes, which grew 62.3 times compared with just 3.8 times for lower denomination notes. During the same period, imports from China surged 162 times, displaying an even stronger long run relationship with high denomination notes than GDP itself. In 2026 alone, the stock of high-denomination notes registered an exceptionally large annual increase of ₹3.54 trillion, alongside an almost ₹2 trillion rise in imports from China.
Flow of HDNs, Non-HDNs and Chinese Imports
The graph reveals a striking contrast: HDNs closely track imports from China, whereas non-HDNs diverge markedly, pointing to a structural relationship between Chinese imports and demand for HDNs.
Missing Link
The relationship becomes even more compelling during 2021 and 2022, which served as a natural experiment. Despite an unprecedented surge in digital payments, high denomination notes recorded one of their largest annual increases. The RBI's Digital Payments Index rose sharply, yet ₹500 and above notes expanded by ₹4.02 trillion in 2021 and another ₹2.84 trillion in 2022. Lower denomination notes, by contrast, barely changed and even declined slightly in 2022.
Powerful Validation
The pandemic years provided a natural experiment. Despite negative GDP growth in 2020-21 and an unprecedented surge in digital payments, ₹500 and above notes increased by ₹4.02 trillion in 2021 and another ₹2.84 trillion in 2022, while lower denomination notes remained broadly unchanged. The same period also witnessed unusually large imports from China—PPE kits, testing equipment, pulse oximeters and medical devices in 2020-21, followed by laptops, routers, webcams and other electronics in 2021-22. This close co-movement strengthens the case that informal trade settlement mechanisms associated with imports are contributing to persistent demand for high-denomination currency.
This interpretation is consistent with long recognised concerns over under invoicing and covert imports. The Directorate of Revenue Intelligence, the Parliamentary Standing Committee on Commerce and Global Financial Integrity have all documented trade mis-invoicing as a significant channel for illicit financial flows. According to Global Financial Integrity, India lost about $9 billion in revenue to import mis-invoicing from China in 2016 alone.
Evidence from Demonetisation
Additional insight comes from CBDT data [Table 2] on deposits of high-denomination notes during demonetisation. About 95% of the ₹7.72 lakh crore deposited came from accounts depositing between ₹2 lakh and ₹25 crore, while deposits above ₹25 crore accounted for only 1.9% of the total. Rather than being concentrated in a few large cash hoards, the data suggest that high-denomination notes were widely dispersed across households, business, trading and manufacturing networks. Given the pervasive presence of Chinese imports across India's consumption basket, trading channels and manufacturing supply chains, this granular pattern of circulation is consistent with widespread cash-intensive commercial activity. A better understanding of these cash flows might have led to a different design or calibration of the demonetisation strategy.
Table 2: Amount-wise Cash Deposited during Demonetisation
|
Cash Deposit Range
|
Bank Accounts Nos.
|
Average Deposit Size[₹]
|
Total Deposits*
[₹ In trillion]
|
|
₹ 200,000 -1 million
|
10 million
|
503,000
|
5.03 [65.2%]
|
|
₹1 million-10 million
|
900,000
|
2.5 million
|
0.23 [3.0%]
|
|
₹10 million-250 million
|
100,000
|
23 million
|
2.31 [29.9%]
|
|
More than ₹250 million
|
462
|
328.5 million
|
0.15 [1.9%]
|
|
Total
|
11 million
|
|
7.72 [100%]
|
* Figures in brackets represent % share in total deposits
Source: CBDT Statistics 2018 as quoted in “Demonetisation 2016 and Its Impact on Indian Economy and Taxation” 2019 by Pratap Singh, The Institute for Social and Economic Change, Bangalore
Broader Costs
The implications extend well beyond currency demand. Covert and under invoiced imports can tilt incentives away from manufacturing towards trading and assembly while creating uncertainty over prices, quality and quantities. Such distortions weaken investment confidence, reduce competitiveness and undermine domestic industry.
The outcome is visible in India's manufacturing performance. Manufacturing output grew at a CAGR of less than 4% between 2012 and 2026, far below the ambitions of the National Manufacturing Policy and Make in India. Manufacturing's share of GDP has remained stuck at around 14 to 16%, well short of the 25% target. Weak manufacturing growth ultimately affects employment, productivity and long-term economic expansion.
The post pandemic deterioration in trade credit provides another piece of the puzzle. While digital payments transformed retail transactions, delayed receivables and weakening business confidence reduced the availability of trade credit. Firms responded by holding larger precautionary cash balances, helping explain why currency demand remained elevated even as digital payments accelerated.
India's liquidity system therefore extends beyond a simple choice between cash and digital payments. It also encompasses trade credit, informal settlements and formal banking liquidity. Developments in one part of this ecosystem inevitably spill over into the others.
Recognising this broader framework has important policy implications. More frequent, intelligence-led and surprise inspections of import consignments, supported by verification of invoices and declared values at ports and airports—the primary entry points for imports—and complemented by risk-based scrutiny of suspicious transactions, could curb under-invoicing without disrupting legitimate trade. Such an approach is administratively feasible, efficient, cost effective, consistent with WTO obligations, and would help create a more level playing field for domestic manufacturers by improving tax compliance, strengthening monetary management and reducing distortions arising from illicit trade.
.png)