.png)

T.K. Arun, ex-Economic Times editor, is a columnist known for incisive analysis of economic and policy matters.
March 2, 2026 at 5:44 AM IST
The automobile industry is getting all worked up over the prospective Corporate Average Fuel Efficiency norms III that the Bureau of Energy Efficiency has proposed for the period 2027-32. Much of the heat is generated over granting small cars special leeway in terms of the emissions allowed, with Maruti Suzuki in favour, and the rest of the industry violently opposed.
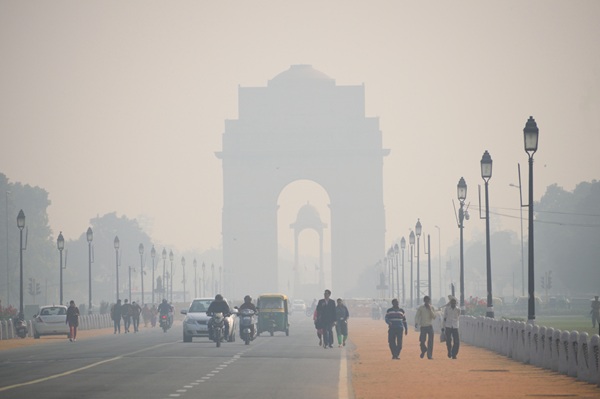
But this is not a debate that matters to automakers alone. It matters to public health, immensely. With Indian cities competing with one another to climb the rankings of the world’s most polluted sites, limiting vehicular emissions is not just a question of contributing to the worldwide battle against climate change, but also a question of limiting the mass of particulate matter smaller than 2.5 microns across (PM 2.5) that people inhale every moment of their lives, penetrating their lungs’ inner tissue and going into the bloodstream, accelerating the formation of artery-choking plaque and encouraging cancers.
Air pollution stunts young brains, shortens lives, increases morbidity, and curtails productivity. Harvard economist Gita Gopinath recently estimated the cost of air pollution for the Indian economy to be $339 billion or 9.5% of GDP, taking 1.7 million lives alongside. Vehicular emissions are a major source of air pollution and PM 2.5 particles.
The government’s effort to reduce vehicular emissions follows a standard global protocol: issue fuel efficiency norms, specific to each manufacturer, calculate actual performance, and penalise underperformance, the penalty increasing non-linearly with the degree of underachievement.
The norm is different for different Original Equipment Makers because each automobile brand has its own different models with different kerb weights (weight of a parked car with no one inside) and different levels of fuel efficiency. For each OEM, a Corporate Average Fuel Efficiency, or CAFÉ, norm is computed, so that it is the automaker’s average performance that is targeted, and not the efficiency of a particular model. CAFE takes into account the weight of each model, the number of each model of vehicle manufactured or imported, the excess of the OEM’s average vehicle weight for all its models over a number that BEE pegs as the average for all light vehicles made by the industry, and the target number of litres of petrol required per kg of vehicle weight to travel 100 km. This last number would keep coming down year after year during the CAFE time horizon.
The actual performance of how many litres of fuel was used to move, on average, vehicles of each make over 100 km is then computed. The computation is made extrapolating the result of a performance measure established when each model is type-certified by the regulator before being permitted for sale. This measures how many grammes of CO2 is released to run the vehicle for one km.
One litre of petrol produces, when burnt, 2,371.35 gramme of CO2. The volume of petrol required to produce 1 gm of CO2 is 1 litre/2371.35 g = 0.04217 litre per gramme of CO2. The performance indicator established at the time of type certification, in terms of so many grammes of CO2 generated to move that model of vehicle one km, can then be used to compute the fuel required to move that model of vehicle a distance of 100 km: multiply the performance indicator by 0.04217, and you get the quantity of fuel required to move that make of vehicle one km, and multiply that number by 100, and you get the petrol volume required to move that model of vehicle 100 km.
The amount of CO2 generated by burning diesel or other fuels is different, naturally. This yields multiples different from petrol’s 0.04217 for other fuels (0.03776 for diesel, 0.06150 for LPG, and 0.03647 for CNG) to establish how much fuel is required to move the vehicle model using these different fuels to run one km. Fuel consumption of every electricity driven model is measured in terms of kWh per one hundred kilometre as per type approval.
These raw figure for litres of fuel to move 100 km are then all converted to petrol equivalent, using standard conversion factors, multiplying the respective fuel volume numbers by 1.1168 for Diesel, 0.6857 for LPG, 1.1563 for CNG and 0.128 for electricity.
These numbers are eligible for further modification, to take into account two more factors, One is for carbon saving technology, to be determined at the time of type certification, and it can lie anywhere on the range between 0 and 1. Another is super-credits for vehicle types, in the form of a volume derogation factor, depending on whether your engine type. It is the maximum of 3 for battery electric vehicles and range extender electric vehicles (in these, the petrol is used to run a turbine that generates electricity, and the electricity drives the motor running the vehicle, avoiding the energy loss in internal combustion engines, and optimizing conversion of chemical energy into electricity and electricity into the kinetic energy that moves the car). Plug-in hybrids, and strong hybrids that use flex fuel ethanol, rather than petrol, get 2.5. Strong hybrids running on petrol qualify for 2. And flex fuel ethanol vehicles get 1.5.
Small cars are afforded an arbitrary 3 gm of CO2 per km deduction from their performance indicator, giving them an advantage in determining how many litres of fuel are required to run 100 km. This has drawn flak.
The complexity of constructing the CAFE norms might give the impression that it is all very systematic and scientific. Actually, these are wholly pre-digital and pre-AI and can be improved upon significantly.
The preferential treatment for ethanol is wholly arbitrary. Electric vehicles are not treated as zero-emission, because the electricity they use causes pollution during generation. However, the energy footprint of ethanol is ignored — 56% of ethanol in India is derived from grain, including rice, and both grain and sugarcane are grown using lots of energy-intensive irrigation and fertilizer.
There is a bigger, structural flaw.
The weight considered of the cars is the unladen weight, not the weight when passengers sit in them. This gives an unfair advantage to small cars. The fuel number for running 100 km will undergo a rise when people travel in the car, as compared to moving an empty car. That shift will be proportionately more for a small car than for a big car: when two people together weighing 150 kg travel in a car, the weight pulled by the engine goes up by 16.7% for a car that weighs 900 kg unladen, and by only 7.5% for a car that weighs 2,000 kg.
However, when we factor in the actual number of people who travel in the car, the picture would change again. The ideal number to target is not fuel required for each make of car to run 100 km; rather, it should be the average fuel required to carry a passenger 100 km by each type of vehicle. Even if this is true, how do we get this number? In the pre-digital era, it was indeed, difficult. Today, countless numbers of cameras capture cars moving through cities, past toll gates, getting off at parking lots and storefronts, schools, and hospitals. Today’s technology allows this data to be captured and analysed to get a decent grip on how many passengers travel in each type of car.
Perversely, it might well be that small cars carry more people. Those who own large SUVs typically have multiple cars per residence, so that per car ridership would be low. Actual data remains, of course, to be gleaned from analysing big data from CCTVs.
Then again, the data on how many gm of CO2 is released per km of moving a particular type of vehicle is determined by running the car on a particular ride cycle. India currently uses a Modified Indian Ride Cycle, which is supposed to be superseded by switching over to Worldwide Harmonized Light Vehicles Test Procedure (WLTP), which is in tune with much of global practice and will help with exports. However, this is also a hypothetical test scenario run in a lab. These need to be abandoned in favour of data captured from cars running on actual city streets.
This is what China does. It has fitted thousands of cars with onboard monitoring kit, and observes traffic movements using Global Positioning System data. The Chinese found that the actual data made for greater proportions of idling, more erratic acceleration and deceleration, in conformity with congested city traffic, yielding lower fuel efficiency as compared to WLTP norms for the same vehicles.
Nothing compels us to rush to adopt suboptimal CAFE norms. Actual passenger data, and actual driving emissions from monitored sample vehicles and remotely observed traffic conditions will help us formulate more realistic efficiency norms.
Our lungs, brains, longevity and economic productivity are worth that extra effort.
More From BasisPoint