.png)

Datametricx is a veteran journalist tallying the macro game, keeping score of the numbers that shape India’s economy and policy.
March 21, 2026 at 11:12 AM IST
India’s wholesale price inflation rose to an 11-month high of 2.13% in February, driven by higher fuel and power costs as well as firm manufactured product prices. Inflation stood at 1.81% in January and 2.45% a year earlier. On a sequential basis, the Wholesale Price Index rose 0.3%, led by a 1.2% increase in fuel and power and a 0.5% increase in manufactured products. Food inflation edged up to a nine-month high of 1.85%, largely reflecting statistical effect of a low base.
Core WPI inflation inched up to 3.3% from 3.2% a month earlier.
With crude prices surging amid the West Asia conflict, wholesale inflation is likely to accelerate further in March. Supply disruptions, particularly through the Strait of Hormuz, could add to cost pressure. However, the pass-through to retail inflation is expected to remain limited for now, as the government has yet to allow oil marketing companies to raise pump prices. That said, higher prices of cooking gas and aviation jet fuel are likely to feed into consumer prices.
India’s merchandise trade deficit narrowed to $27.10 billion in February from $34.68 billion in January, but remained elevated due to a surge in imports, particularly gold and silver. The deficit was 88.0% higher than a year ago. Imports rose 24.1% year-on-year to $63.71 billion, while exports slipped 0.8% to $36.61 billion, weighed down by a 40.1% contraction in petroleum products shipments to $3.43 billion.
Gold and silver imports surged 228.9% to $9.11 billion, while electronic goods and machinery imports rose 33.4% to $10.10 billion and 23.5% to $5.33 billion, respectively.
Looking ahead, higher crude imports are likely to push up India’s import bill further. Continued disruption in the Strait of Hormuz could weigh on exports, particularly to West Asia, while remittances from the Gulf may come under pressure, adding to external vulnerabilities.
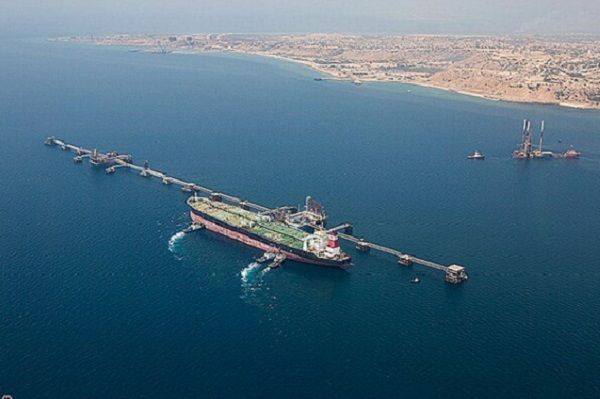
India’s crude oil basket climbed to a record $156.29 per barrel as of March 19, more than twice the level of $70.70 a month ago and $71.82 a year earlier. The basket remains significantly higher than Brent crude futures reflecting its composition, largely Oman and Dubai spot prices with a smaller Brent component.
Growth in India’s eight core infrastructure industries slowed sharply to a three-month low of 2.3% in February from a revised 4.7%, as expansion moderated across six of the eight sectors. These industries – spanning coal, crude oil, natural gas, refinery products, fertilisers, steel, cement, and electricity – account for 40.3% of the Index of Industrial Production.
Crude oil output contracted for the sixth straight month, while natural gas output declined for the 20th consecutive month. Growth in steel and cement sectors slowed to 7.2% and 9.3%, respectively, though both sectors continue to underpin overall core sector expansion. Electricity generation growth decelerated sharply to 0.5% from 5.2% a month earlier.
Despite recent moderation, steel and cement output rose 9.7% and 9.2%, respectively, during April–February, compared with overall core sector growth of 2.9%.
India’s unemployment rate eased marginally to 4.9% in February from 5.0% in January, led by a decline female joblessness. The female unemployment rate fell to 5.1% from 5.6, while the male rate was unchanged at 4.8%. Urban unemployment declined to 6.6% from 7.0%, while the rural rate held steady at 4.2%.
Consumption of petroleum products rose 4.7% year-on-year to 20.24 million tonnes in February, supported by robust demand for liquefied petroleum gas, which increased 9.3% to 2.82 million tonnes. Petrol and diesel consumption climbed 6.1% to 3.37 million tonnes and 4.3% to 7.66 million tonnes, respectively. However, LPG demand may soften in March following restrictions on sales to non-residential consumers.
Foreign exchange reserves fell to a seven-week low of $709.76 billion as of March 13, primarily due to central bank intervention to stabilise the rupee. Reserves declined $7.05 billion during the week, with foreign currency assets falling by $7.68 billion. Gold reserves rose by $664 million to $130.68 billion and are up $51.84 billion so far this financial year, even as physical holdings remain unchanged.
External commercial borrowings rose to a 10-month high of $5.33 billion in January from $4.44 billion in December. Export Import Bank of India was the largest borrower during the month with a $1 billion loan, followed by Microsoft Corporation (India) at $726.99 million, Muthoot Finance at $600 million, and Housing and Urban Development Corporation at $446.24 million.
Overseas direct investment by Indian entities declined 36% year-on-year to $2.76 billion in February. Equity investments fell 58% to $1.11 billion, while loans fell 11% to $714 million and guarantees increased 5% to $937 million.
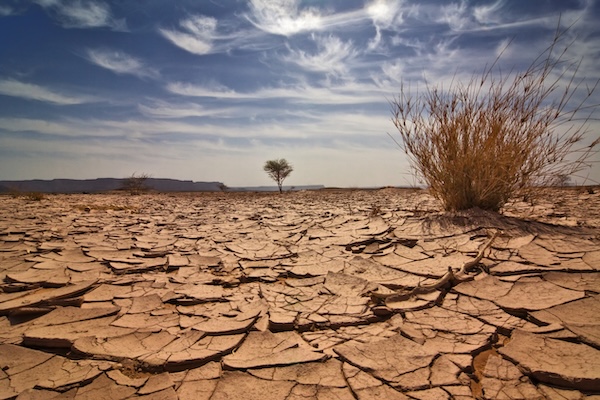
The pre-monsoon rainfall has improved after a weak start, with cumulative precipitation for March 1-20 broadly in line with long-period average. Reservoir storage levels, though declining, remain well above historical norms. As of March 19, water levels in 166 reservoirs stood at 94.06 billion cubic metres, or 51% of their total live capacity — 14% higher than a year earlier and 26% above the 10-year average. These reservoirs are typically replenished during the southwest monsoon.
Coming up
- Mar 24: HSBC India Flash PMI for March
- Mar 28: Index of Industrial Production for February
- Mar 31: Government finances for April-February
Tailpiece
India’s consumption of liquefied petroleum gas rose 8.0% year-on-year to 30.89 million tonnes during April-February, while domestic production stood at 11.72 million tonnes, meeting 38% of total demand.
More From BasisPoint