.png)

Dhananjay Sinha, CEO and Co-Head of Institutional Equities at Systematix Group, has over 25 years of experience in macroeconomics, strategy, and equity research. A prolific writer, Dhananjay is known for his data-driven views on markets, sectors, and cycles.
June 23, 2026 at 9:28 AM IST
A routine assessment of Indian household conditions revealed an anomalous 17% year-on-year surge in reported rural wages for male workers in March 2026, a sharp departure from the 5–6% growth typically observed in previous years.
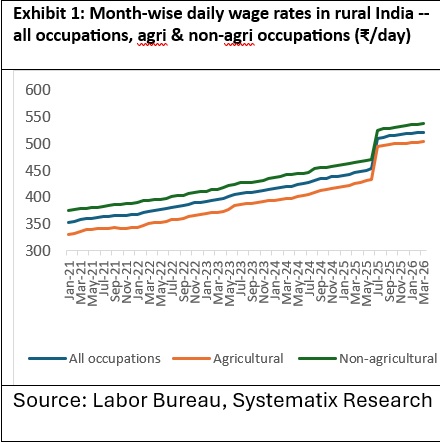
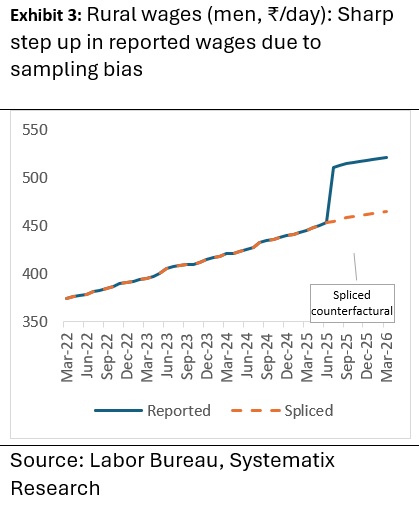
A closer examination revealed an extraordinary jump in average daily wages beginning in July 2025. The average across all occupations increased 12.7% month on month, from ₹454 a day in June 2025 to ₹511 a day in July 2025.
The divergence is even more striking when growth rates are compared.
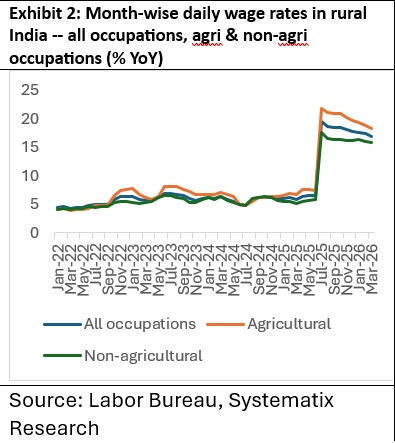
During the ten months ending June 2025, average wage growth stood at 6.23% year on year all occupations, 6.79% for agricultural occupations and 5.75% for non-agricultural occupations.
By March 2026, the corresponding rates had jumped to 18.12%, 20.16% and 16.40%, respectively. Although growth moderated slightly in March 2026, the average daily rural wage still stood at ₹522, implying a 17% annual increase.
Occupation-wise data reveal particularly large increases, with wages for fishing in coastal and deep-sea areas rising 62% month on month in July 2025 and wages for beedi makers increasing 29%
Such an abrupt increase in rural wages is anomalous and appears to stem from a change in estimation methodology rather than a genuine improvement in underlying labour-market conditions.
The Forensics
The Labour Bureau website (https://labourbureau.gov.in/) provides no explanation for the break, and no press release was issued when the series changed. Direct communication with Bureau officials indicates that the methodology used to estimate rural wage data underwent substantial revision.
According to officials, the Bureau adopted the sampling framework used in the new CPI series for agricultural and rural labourers (CPI-AL/RL), with base year 2019 replacing 1986-87. Under the revised methodology, the sample expanded from 600 villages across 20 states to 787 villages across 34 states and union territories (UTs), bringing several smaller northeastern states and UTs into the sample for the first time.
In addition, the following state pairs were treated separately for sampling purposes: Bihar and Jharkhand; Uttar Pradesh and Uttarakhand; Madhya Pradesh and Chhattisgarh; and Andhra Pradesh and Telangana.
The revised sampling structure assigned a combined weight of about 11% to 10 newly added states and UTs, including several northeastern states, the National Capital Territory of Delhi and Goa, reducing the weight assigned to states in the original 1986–87 sample. While the combined weight of Bihar and Jharkhand increased modestly to 7.9%, up 1.4 percentage points, the largest reductions were in Maharashtra, down 2.6 percentage points; Madhya Pradesh and Chhattisgarh, down 1.7 percentage points; Odisha, down 1.7 percentage points; and West Bengal, down 1.9 percentage points.
These methodological changes have not been formally disclosed in any Labour Bureau publication. Yet a simple press note in July 2025, or even a footnote accompanying the data release explaining the methodology change and providing a linking factor to the earlier series, would have sufficed. The absence of such disclosure months after the introduction of the new series raises serious concerns about transparency and data quality.
Why Did the Expanded Sample Cause Such a Large Increase in Wages?
While a definitive explanation will require official methodological documentation, the main reason appears to be a shift in sample weights towards regions with significantly higher average wages but smaller shares of the national workforce and population.
The newly added regions, including northeastern states, Goa and the National Capital Territory of Delhi, have smaller shares of workers engaged in agricultural occupations and a higher concentration of relatively skilled employment.
As a result, average daily wages in these regions are approximately 50–55% higher than in the original sample states
Evidence from the Annual Periodic Labour Force Survey confirms that wages in the newly added regions exceed the national average. A counterfactual reconstruction of the earlier wage series yields similar conclusions.
The revised sample appears to introduce significant sampling bias. The newly added states and UTs accounted for only 1.15% of India’s rural population and 1.22% of its workforce according to the 2011 Census, yet they now account for roughly 11% of sample villages in the revised Labour Bureau series (787 for Base 2019), almost 10 times their population and workforce shares.
These regions also exhibit substantially higher educational attainment than the national average, with larger shares of workers possessing secondary education, diplomas and higher qualifications. It is therefore unsurprising that incorporating these regions into the sample produced a structural break in both wage levels and reported wage growth.
The 11% weight assigned to these regions pulls up the national average wage, making the headline estimate less representative of the broader rural economy.
CPI Measurement
The same sampling framework underlies the new CPI-AL/RL series, raising concerns that similar distortions may affect inflation estimates as well.
A preliminary examination of state-level CPI data suggests that inflation in these newly added regions averaged approximately 2.9%, substantially below the national average of 3.9% in May 2026. Consequently, the revised sampling framework appears to create an upward bias in nominal wage estimates while exerting a downward bias on measured inflation.
Wage Trend
To separate genuine wage dynamics from the effects of resampling, a splicing approach was applied. Specifically, the momentum of the old wage series—roughly 0.45–0.55% month on month, equivalent to about 5.5–6.8% annualised growth through June 2025—was extrapolated and compared with the new series
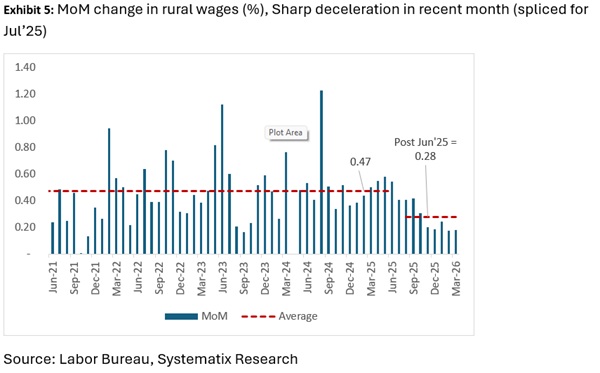
The results suggest that wage momentum has weakened considerably, pulled down by slower nominal wage growth in the newly added regions. Under the new series, average monthly growth decelerated to 0.28%; during February–March 2026, it fell further to 0.18% month on month, implying an annualised rate of roughly 2.2%.
After adjusting for the sampling-induced break, underlying wage growth in March 2026 is estimated at about 4.3% year on year, the weakest pace in four years (Exhibit 4). The reported 17% growth therefore substantially overstates underlying wage conditions.
With CPI inflation rising to 4% and expected to approach 6% in the coming months, slowing wage growth raises the likelihood that real wages may once again contract, despite the apparent spike in nominal wages reported by the new series.
Reverse Migration
The slowdown in rural wages and the flattening of real wages over the past 10 months predate the West Asia crisis, which has since deepened the squeeze. Media reports indicate that the conflict-driven energy crisis has prompted another episode of reverse migration across India, reminiscent of the 2020 pandemic lockdowns, as migrant workers leave major urban centres for their villages.
A fivefold spike in informal-market LPG prices and widespread factory shutdowns in energy-dependent sectors have left low-income labourers facing an impossible trade-off as living costs outpace incomes. This reverse migration is likely to put further downward pressure on rural incomes as workers swap urban jobs for less productive farm work in a sector ill-equipped to absorb a continued rise in labour dependence. The timing is especially damaging because Indian agriculture also faces the risk of a Super El Niño, which could hurt productivity and farm incomes.
The Upshot
The apparent surge in rural wages is largely a statistical artefact arising from an undisclosed change in sampling methodology. The revised series appears less representative of national rural labour-market conditions because the expanded sample is not aligned with the underlying distribution of population and workers across India.
Given that the new CPI series relies on the same village sampling framework, similar concerns may apply to inflation measurement. These issues are compounded by the absence of a new census, with India still relying on demographic benchmarks from 2011. PLFS data show that the rural share of the workforce has risen since 2018 following a series of economic shocks. Shifts in the rural-urban distribution of labour and population may therefore have introduced additional sampling errors.
The anomaly in rural wage estimation adds to broader concerns about the transparency and reliability of India’s official economic statistics. Similar controversies have emerged in recent years around employment data, survey redesigns and methodological changes. While analysts and researchers conduct forensic examinations to identify inconsistencies, the broader public is often presented only with headline numbers that appear robust.
Increasingly, major household and labour surveys—including HCES, ASUSE and PLFS—have undergone substantial methodological revisions following long periods of discontinuation. These changes make historical comparisons difficult and reduce the scope for constructing consistent back-series data. The same challenge now applies to the revised GDP series (base year 2022–23).
Indeed, the incorporation of these redesigned surveys has resulted in a significant downward revision to private consumption expenditure. Under the revised GDP series, India’s Private Final Consumption Expenditure (PFCE), the largest component of GDP, has been revised down by approximately 10–11% between 2022–23 and 2025–26. This implies that nearly ₹80 lakh crore of previously estimated consumption expenditure has effectively disappeared from the national accounts.
The revision reinforces concerns that earlier measures of consumption—and therefore GDP—may have overstated underlying economic activity. At the same time, inflated rural wage estimates and the growing sensitivity of PFCE to urban and premium consumption indicators, such as passenger vehicle sales, raise questions about the reported strength of household demand and the estimated 7.7% real consumption growth in FY26.
The latest wage data suggest that rural income growth may have decelerated sharply in recent months. Combined with the potential impact of El Niño conditions on India’s agrarian economy and rising fuel and fertiliser costs, policymakers face an increasingly difficult trade-off between supporting rural incomes and maintaining fiscal discipline.
More From BasisPoint