.png)

Dr. Smita Roy Trivedi is an Associate Professor at the National Institute of Bank Management (NIBM), Pune.

Dr. Abhiman Das is a Professor of Economics at the Indian Institute of Management Ahmedabad.
April 3, 2026 at 11:16 AM IST
It has been four weeks since the US and Israel began large-scale air-strikes on Iran, the third major escalation in a series of post-pandemic interstate conflicts, and the economic fallout is already unmistakable. Rising energy prices, inflationary pressures, disrupted trade flows, and choppy financial markets are converging, with the most vulnerable sections of the global population likely to bear the brunt. What does this mean for India as it aspires to become a $30 trillion economy by 2047? We revisit GDP growth dynamics in light of these emerging realities.
First, crude prices are on the rise. India’s inflation remains obsessively sensitive to crude movements, as seen in Figure 1. Almost every episode of crude price escalation has triggered destabilising price increases domestically. For example, Brent Crude reached a high of $142.51 in March 2022 following the Russian invasion of Ukraine in October 2021. Indian CPI inflation jumped to a 95-month high of 7.8% in April 2022.
More recently, CPI (overall, rural and urban) inflation has inched up from 0.25% in October 2025 to 2.75% in January 2026 and 3.21% in February 2026. With crude prices jumping from $61.45 in January to $128.48 in March, it is only a matter of time before this feeds more sharply into domestic inflation.
Figure 1: Oil vs India CPI Inflation
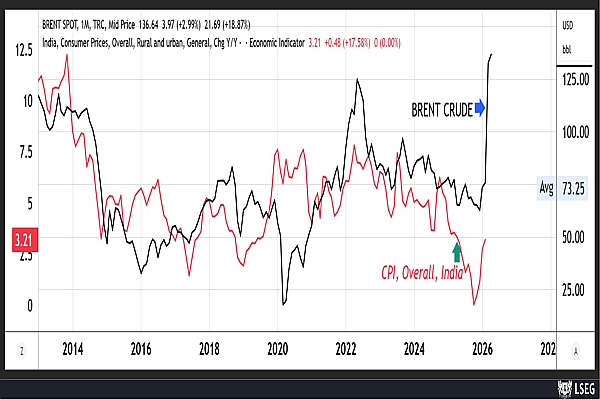
Source: LSEG, annotations: Authors
The underlying issue remains India’s energy dependency on crude. As of February 2026, petroleum, crude and related products account for 20.36% of imports in rupee terms, while petroleum products contribute around 9.36% to export earnings. Importantly, this dependence persists despite years of policy focus on energy sufficiency, including bio-energy, green hydrogen and solar missions, and the build-up of strategic petroleum reserves.
Crude is a universal intermediate. The first-order impact of higher crude prices will be direct pass-through to fuel and fertiliser costs, feeding into higher transportation costs and food inflation. The second-order impact will emerge through increased wage costs to compensate for the immediate rise in energy and food prices, translating finally to a stronger pass-through in services than in goods. Overall, a wage-push spiral is unavoidable as second-round effects begin to take hold.
Second, a sharper depreciation of the rupee is expected. Figure 2 plots monthly brent crude prices (candlesticks) alongside the rupee (line graph). Three major depreciation episodes are highlighted: the 2013 taper tantrum (₹68 per USD); the 2018–19 phase (high of ₹74); and the 2022 episode (nearly ₹83). Each coincided with an underlying rise in crude prices, as highlighted by the rectangular bands. The current episode, as the monthly candle clearly indicates, is a tectonic geopolitical crisis for crude: the sharp and discontinuous move implies that exchange rate pressures may persist, with longer-term macroeconomic repercussions.
Figure 2: Crude and INR movement
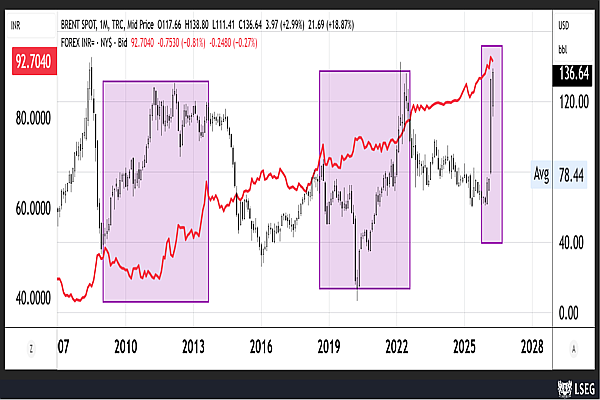
Source: LSEG, annotations: Authors
Growth Risks
Figure 3 highlights the movement between crude and gold across recent geopolitical crises.
During the Russia-Ukraine conflict, crude prices spiked sharply and gold initially surged before stabilising. From the 2025 Israel-Gaza conflict onwards, gold exhibited a stronger upward trajectory even as crude remained relatively contained. The ongoing US–Israel–Iran conflict departs from both patterns: crude surged sharply, while gold presumably corrected.
However, heightened uncertainty is likely to support gold at current levels, even as crude continues to reflect the fallout of the US-Iran conflict. The gold–crude relationship remains highly state-dependent, strengthening during periods of geopolitical stress as supported by literature.
Figure 3: Gold and Crude oil
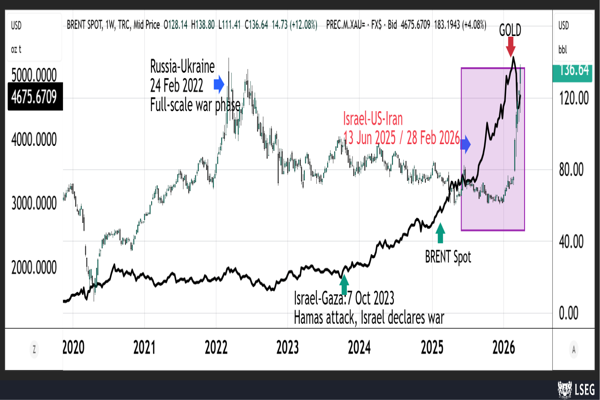
Source: LSEG, annotations: Authors
What does this mean for India and the $4 trillion economy narrative? First, the new GDP data series clearly shows an overestimation of the size of the Indian economy. Without accounting for rupee deprecation, nominal GDP appears overstated by around 3-4% (Table 1).
When adjusted for rupee depreciation using yearly averages, India’s GDP in dollar terms has grown from $3.24 trillion in 2022-23 to only $3.93 trillion in 2025-26 (Table 1)—an increase of just $0.69 trillion over four years.
Notably, the pace of expansion has slowed down considerably in 2025-26 due to unprecedented depreciation dynamics. With increasing geopolitical tensions, volatile crude dynamics and Trump’s tariff tantrums, depreciation pressure is likely to intensify. Faster depreciation will not only delay the $4 trillion milestone but could also push the $30 trillion ambition for 2047 further out of reach.
Table 1: Nominal GDP comparison: new vs old series
More From BasisPoint