.png)

Dhananjay Sinha, CEO and Co-Head of Institutional Equities at Systematix Group, has over 25 years of experience in macroeconomics, strategy, and equity research. A prolific writer, Dhananjay is known for his data-driven views on markets, sectors, and cycles.
June 23, 2026 at 9:28 AM IST
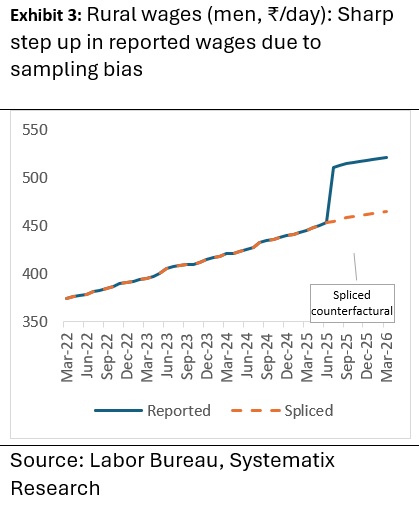
A standard review of rural living conditions in India uncovered something unusual: male rural wages jumped 17% year-on-year in March 2026, far above the typical 5–6% annual growth seen in prior years.
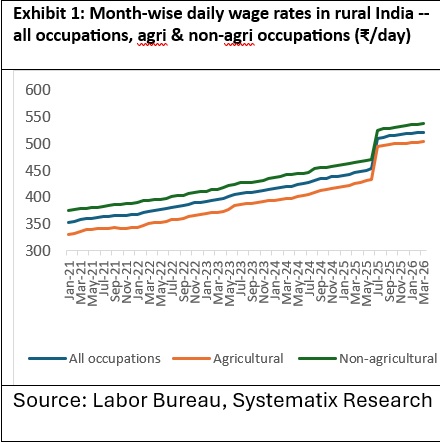
Digging deeper, the data showed wages had already begun spiking dramatically starting in July 2025. Across all occupations, the average daily wage rose 12.7% in a single month, from ₹454 in June 2025 to ₹511 in July 2025.
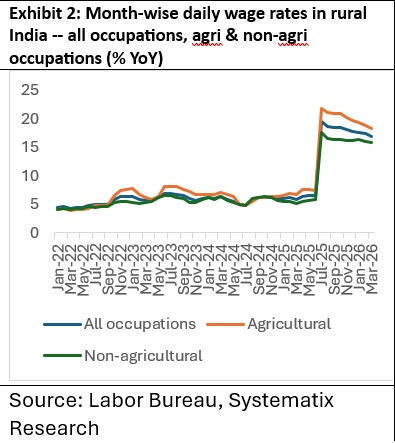
The contrast becomes even clearer when looking at growth rates over time. For the ten months leading up to June 2025, year-on-year wage growth averaged 6.23% across all occupations, 6.79% for agricultural work, and 5.75% for non-agricultural work.
Just nine months later, by March 2026, those same 10-month average growth figures had surged to 18.12%, 20.16%, and 16.40% respectively, roughly three times the earlier rates.
A breakdown by occupation shows even sharper spikes: wages for coastal and deep-sea fishing workers jumped 62% in just one month (July 2025), while beedi makers saw a 29% increase over the same period. Other occupations saw significant rise include Animal Husbandry, Weavers, and Bamboo & cane basket making.
An increase this sudden and steep doesn't fit the pattern of normal labour-market improvement, it points instead to a shift in how the data was being calculated, rather than any real change in wage conditions on the ground.
Digging Into the Data
No explanation for this break appears on the Labour Bureau's website, and no press release accompanied the change. However, conversations directly with Bureau officials confirm that the methodology behind rural wage estimation was significantly overhauled.
Officials say the Bureau switched to the sampling framework used in the new CPI-AL/RL (Consumer Price Index for Agricultural and Rural Labourers) series, shifting the base year from 1986-87 to 2019. This revision expanded the sample size considerably, from 600 villages across 20 states to 787 villages spanning 34 states and union territories, and, for the first time, included several smaller northeastern states and UTs that had previously been left out.
Additionally, these state pairs were sampled separately: Bihar–Jharkhand, Uttar Pradesh–Uttarakhand, Madhya Pradesh–Chhattisgarh, and Andhra Pradesh–Telangana.
The new sampling structure gave a combined weight of roughly 11% to 10 newly added states and UTs, including several northeastern states, Delhi, and Goa, which came at the expense of states from the original 1986–87 sample. Bihar and Jharkhand's combined weight rose slightly to 7.9% (+1.4 percentage points), while the biggest losses were in Maharashtra (-2.6 points), Madhya Pradesh-Chhattisgarh (-1.7 points), Odisha (-1.7 points), and West Bengal (-1.9 points).
None of this has been formally disclosed by the Labour Bureau. A simple press note or footnote explaining the change — and providing a linking factor to the old series — would have been enough. Its absence, months after the new series took effect, raises real concerns about transparency and data quality.
Why Did the Expanded Sample Cause Such a Large Increase in Wages?
While a definitive explanation will require official methodological documentation, the main reason appears to be a shift in sample weights towards regions with significantly higher average wages but smaller shares of the national workforce and population.
The newly added regions, including northeastern states, Goa and the National Capital Territory of Delhi, have smaller shares of workers engaged in agricultural occupations and a higher concentration of relatively skilled employment.
As a result, average daily wages in these regions are approximately 50–55% higher than in the original sample states.
Evidence from the Annual Periodic Labour Force Survey confirms that wages in the newly added regions exceed the national average. A counterfactual reconstruction of the earlier wage series yields similar conclusions.
The revised sample appears to introduce significant sampling bias. The newly added states and UTs accounted for only 1.15% of India’s rural population and 1.22% of its workforce according to the 2011 Census, yet they now account for roughly 11% of sample villages in the revised Labour Bureau series, almost 10 times their population and workforce shares.
These regions also exhibit substantially higher educational attainment than the national average, with larger shares of workers possessing secondary education, diplomas and higher qualifications. It is therefore unsurprising that incorporating these regions into the sample produced a structural break in both wage levels and reported wage growth.
The 11% weight assigned to these regions pulls up the national average wage, making the headline estimate less representative of the broader rural economy.
CPI Measurement
The same sampling framework underlies the new CPI-AL/RL series, raising concerns that similar distortions may affect inflation estimates as well.
A preliminary examination of state-level CPI data suggests that inflation in these newly added regions averaged approximately 2.9%, substantially below the national average of 3.9% in May 2026. Consequently, the revised sampling framework appears to create an upward bias in nominal wage estimates while exerting a downward bias on measured inflation.
Wage Trend
To separate genuine wage dynamics from the effects of resampling, a splicing approach was applied. Specifically, the momentum of the old wage series—roughly 0.45–0.55% month on month, equivalent to about 5.5–6.8% annualised growth through June 2025—was extrapolated and compared with the new series.
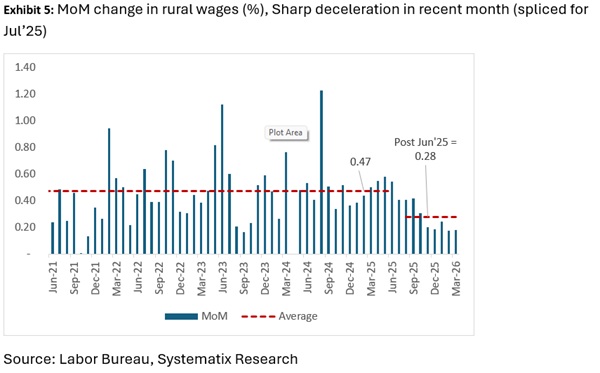
The results suggest that wage momentum has weakened considerably, pulled down by slower nominal wage growth in the newly added regions. Under the new series, average monthly growth decelerated to 0.28%; during February–March 2026, it fell further to 0.18% month on month, implying an annualised rate of roughly 2.2%.
After adjusting for the sampling-induced break, underlying wage growth in March 2026 is estimated at about 4.3% year on year, the weakest pace in four years (Exhibit 4). The reported 17% growth therefore substantially overstates underlying wage conditions.
With CPI inflation rising to 4% and expected to approach 6% in the coming months, slowing wage growth raises the likelihood that real wages may once again contract, despite the apparent spike in nominal wages reported by the new series.
Reverse Migration
The slowdown in rural wages and the flattening of real wages over the past 10 months predate the West Asia crisis, which has since deepened the squeeze. Media reports indicate that the conflict-driven energy crisis has prompted another episode of reverse migration across India, reminiscent of the 2020 pandemic lockdowns, as migrant workers leave major urban centres for their villages.
A fivefold spike in informal-market LPG prices and widespread factory shutdowns in energy-dependent sectors have left low-income labourers facing an impossible trade-off as living costs outpace incomes. This reverse migration is likely to put further downward pressure on rural incomes as workers swap urban jobs for less productive farm work in a sector ill-equipped to absorb a continued rise in labour dependence. The timing is especially damaging because Indian agriculture also faces the risk of a Super El Niño, which could hurt productivity and farm incomes.
The Bigger Picture
The rural wage "surge" is largely a statistical illusion, driven by an undisclosed change in sampling methodology. The revised sample appears less representative of India's actual rural labour market, since it doesn't align with the country's real population and worker distribution.
Because the new CPI series draws on the same village-sampling framework, similar distortions may affect inflation data too. These risks are amplified by India's reliance on outdated 2011 census benchmarks, even as PLFS data shows the rural workforce share rising since 2018 amid repeated economic shocks, meaning shifts in the rural-urban population balance could be introducing fresh sampling errors.
This wage anomaly fits a broader pattern of credibility concerns around India's official statistics, from employment data to survey redesigns. Forensic scrutiny by analysts often uncovers inconsistencies that the public, relying on headline figures, never sees.
Several major surveys — HCES, ASUSE, and PLFS — have undergone significant methodological overhauls after long gaps, making historical comparisons unreliable. The same now holds for the rebased GDP series (2022–23 base year). Notably, this rebasing slashed Private Final Consumption Expenditure (PFCE) — GDP's largest component — by roughly 10–11% between 2022–23 and 2025–26, erasing nearly ₹80 lakh crore in previously estimated consumption.
This suggests earlier GDP estimates may have overstated real economic activity. Combined with inflated rural wage data and PFCE's growing reliance on urban, premium-consumption indicators (like car sales), it casts doubt on the reported 7.7% real consumption growth for 2025-26.
If rural income growth has indeed slowed — compounded by El Niño risks and rising fuel and fertiliser costs — policymakers face a tightening trade-off between supporting rural incomes and maintaining fiscal discipline. This tension is heightened by the current stance of fiscal consolidation, marked by reduced allocations to rural development and agriculture, a gradual withdrawal of subsidies, and tighter funding for the rural employment guarantee programme.
What's needed is a departure from the policy playbook followed so far — one centred on managing external capital flows, sustaining monetary accommodation, and piecemeal measures like income tax and GST rationalisation, all of which have offered only limited growth impact at the broader level.
More From BasisPoint