.png)

Datametricx is a veteran journalist tallying the macro game, keeping score of the numbers that shape India’s economy and policy.
October 12, 2025 at 2:17 PM IST
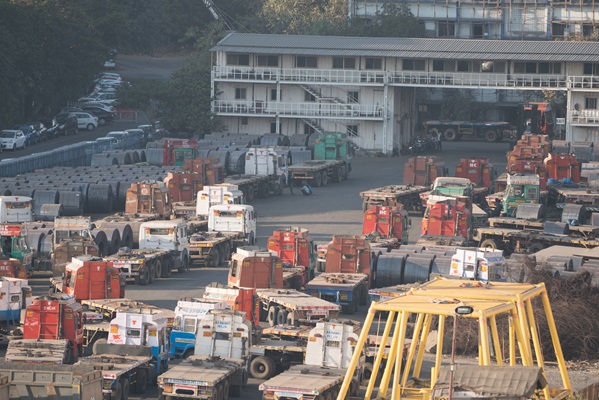
E-way bill generation rose to an all-time high in September, suggesting that companies ramped up production and inventories ahead of the new GST rates taking effect on September 22. E-way bills—GST documents required for transporting goods worth more than ₹50,000—touched a record 132.0 million in September, up 21.0% year-on-year and 2.2% month-on-month. Although higher e-way bill activity typically signals strong GST collections, receipts in October may be lower due to rate rationalisation.
Retail automobile sales rose a tepid 5.2% year-on-year to 1.83 million vehicles in September. Sales were uneven through the month, muted in the first three weeks ahead of the GST rate cuts but surging during the Navaratri week.
Two-wheelers, which account for about 70% of total sales, rose 6.5% to 1.29 million units, while passenger vehicle sales increased 5.8% to 299,369 units. Retail sales of commercial vehicles grew 2.7% to 72,124 units.
The Navaratri week drove strong demand, with festival-period sales rising 34.0% year-on-year on year to 1.16 million vehicles. Two-wheeler sales during the week surged 36.0%, while passenger vehicle sales grew 34.9%.
Rainfall continued unabated across the country even after the southwest monsoon season officially ended in September. As of October 11, India had received a weighted average rainfall of 53.1 mm in the post-monsoon season, 44% above the normal level of 36.9 mm for the period. The post-monsoon is the third wettest season after southwest monsoon and pre-monsoon periods, accounting for around 10% of the country’s annual rainfall.
Kharif sowing rose 0.6% year-on-year to 112.1 million hectares as of October 3, 2.3% above the normal seasonal area of 109.7 million hectares. Rice, which accounts for about 40% of the season’s acreage, increased 1.4% to 44.2 million hectares. Pulse acreage rose 1.2% to 12.0 million hectares, while oilseed acreage declined 5.3% to 19.0 million hectares.
The water level in 161 major reservoirs rose during the week ended October 9, despite the monsoon season ending. Storage stood at 166.7 billion cubic metres, or 91% of live capacity—5% higher than a year ago and 19% above the 10-year average. Although reservoir levels typically fall after the monsoon, this year’s rains have persisted into October.
Above-normal monsoon rainfall, higher Kharif sowing, and abundant reservoir levels are expected to support rural demand and keep food inflation in check.
The HSBC India Services PMI moderated to 60.9 in September from a 15-year high of 62.9 in August. The Composite PMI—a weighted average of the manufacturing and services PMIs—slipped to 61.0 from a 17-year high of 63.2, marking the weakest expansion since June. Despite the moderation, both indices remained well above their long-run averages of 54.3 and 53.8, respectively. The Future Activity Index rose to its highest level since March, indicating stronger optimism among services firms about business prospects.
Open-ended mutual fund schemes recorded their first net outflow in six months, largely due to continued redemptions from debt funds. Open-ended schemes saw a net outflow of ₹428 billion in September compared with an inflow of ₹525 billion in August. Debt fund schemes witnessed outflows of ₹1.02 trillion outflow in September, compared with ₹80 billion in August. Such withdrawals are typical in September, as investors liquidate holdings to meet advance tax obligations.
Open-ended equity fund schemes registered inflows of ₹304 billion in September, slightly lower than ₹334 billion a month earlier. Inflows into equity mutual funds have remained a cornerstone of Indian equity markets, which have seen large outflows from foreign portfolio investors since October last year. Systematic investment plans recorded a monthly contribution of ₹294 billion—the highest ever—supported by 92.5 million active accounts.
With bullion prices touching record highs almost daily, net inflows into gold and silver exchange-traded funds hit record levels of ₹84 billion and ₹53 billion, respectively.
The total assets under management of the mutual fund industry stood at ₹75.61 trillion as of September 30.
Coal production in India declined 1.0% year-on-year to 68.2 million tonnes in September, while despatches fell 0.2% to 74.0 million tonnes. During April-September, coal production and despatches declined 0.7% and 11.1%, respectively, primarily due to lower thermal power generation. Output of thermal plants, which account for about 80% of total coal despatches, fell 5.1% during the first half of the year.
India added 4.51 million telephone subscribers on a net basis in August, up from 1.66 million added in July. With this, the total number of telephone subscribers in the country rose to 1.22 billion, including 1.18 wireless subscribers and 47 million wireline subscribers.
New business premiums of life insurance companies rose 14.8% year-on-year to ₹402 billion in September. Premiums of private life insurance companies increased 17.7% to ₹172 billion, while those of state-owned Life Insurance Corp. rose 12.7% to ₹230 billion. In April-September, premiums grew 7.6% to 2.04 trillion, with private insurers’ income rising 12.2% and LIC up 4.7%. The lower growth has meant that LIC’s market share in new premium income has been falling steadily. LIC’s market share in new premium income fell to 59.4% in April-September from 70.6% in the same period five years ago, underscoring a steady shift toward private insurers.
Gross direct premiums of general insurance companies, including stand-alone health insurers, rose 13.2% year-on-year to ₹312 billion in September. For April-September, premiums increased 7.3% to ₹1.65 trillion. The growth rates are not strictly comparable, as the Insurance Regulatory and Development Authority of India excluded premiums from long-term policy premiums effective October 1, 2024.
Freight traffic handled by major ports rose 5.8% year-on-year to 437.6 million tonnes in April-September, driven by robust growth in crude, petroleum products and container traffic. Crude and petroleum product volumes increased 8.1% to 132.5 million tonnes, while container traffic rose 10.3% to 104.3 million tonnes. Iron ore volumes continued to decline, falling 7.8% to 23.5 million tonnes.
Housing prices across India continued to rise, albeit at a slower pace. The all-India Housing Price Index increased 3.6% year-on-year in April-June, compared with 7.6% a year earlier. The Reserve Bank of India has revamped the index, adopting 2022-2023 as the new base year and expanding coverage to 18 cities from 10 previously.
- Oct 13 – Consumer Price Index for September
- Oct 14 – Wholesale Price Index for September
- Oct 15 – Trade data for September
Tailpiece
India’s overall teledensity rose to 86.4% at the end of August, marginally up from 85.0% at the end of March. The urban teledensity stood at 134.5%—more than double that of 59.3% in rural areas.
More From BasisPoint