.png)

Dhananjay Sinha, CEO and Co-Head of Institutional Equities at Systematix Group, has over 25 years of experience in macroeconomics, strategy, and equity research. A prolific writer, Dhananjay is known for his data-driven views on markets, sectors, and cycles.
April 1, 2025 at 5:21 AM IST
The conundrum of flattening or inverted yield curve and strong consumption demand may not have been as stark as it is today. As per the latest official GDP release, the average growth for FY23-FY24 has been upgraded significantly, and FY25 is expected to deliver 6.5%, resulting in a three-year average of 7.8%. This will be higher than the averages for 60-, 35-, and 26-years at 5.3%, 6.1%, and 6.4%, respectively.
What's more, real private consumption, estimated to have grown at 6.8% in the first three quarters of FY25, is projected to leapfrog to 9.9% in the fourth quarter to make an average of 7.6%.
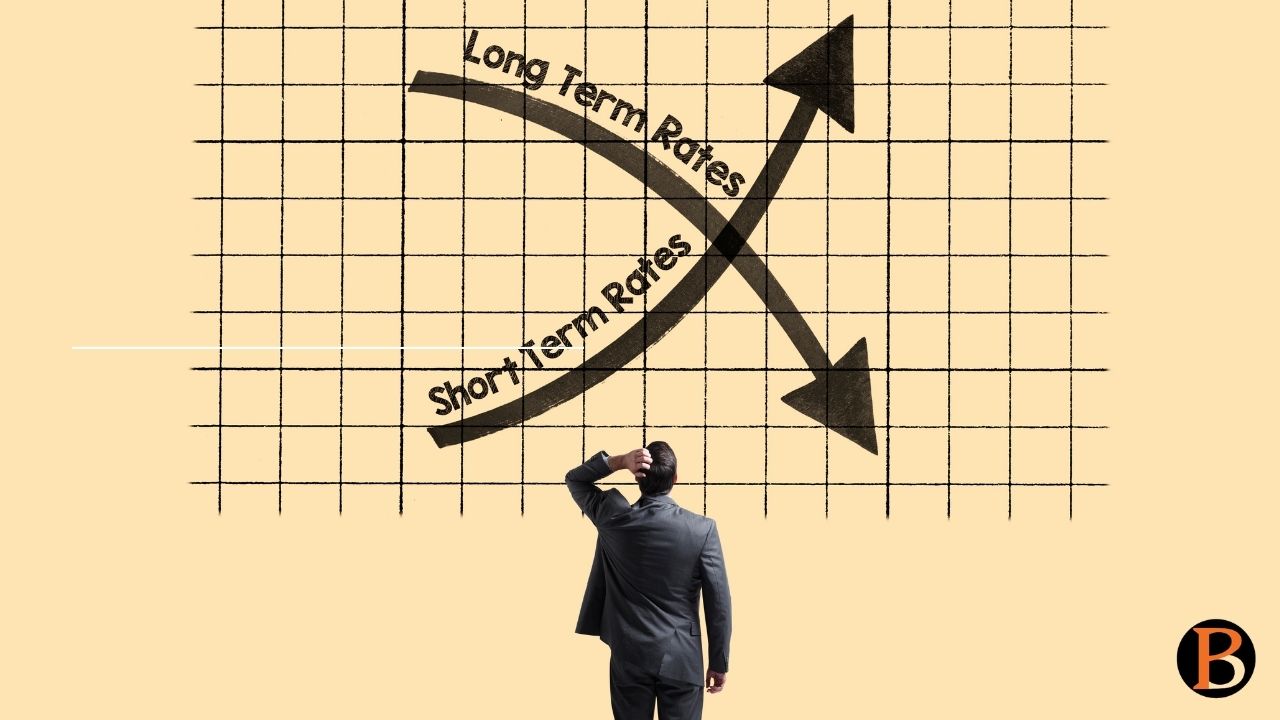
The theory behind the predictive capability of the treasury yield curve is that steepness in the term spread (long-term yield less short-term) is followed by strong growth because a lower short-term rate stimulates strong consumption demand, translating into higher demand for long-term funds.
Conversely, a flat or an inverted yield curve presages growth slowdown as a higher short-term rate slows consumption demand and diminishes demand for long-term funds.
Thus, if the official projections of robust consumption demand are indeed valid, then the Gsec term spread should have been widening instead of flattening.
But what do we have in actuality?
The spread between the 10-year Gsec yield (6.60%) and one month (6.76%, Mar 26, 2025) inverted to -16bp. The curve has been flat since December 2022 with an average 10-1 year spread of 13bp, a precipitous decline from 240 bps during the pandemic highs.
This decline mimics the curve flatness during 2012-2014, which preceded the fragile five narrative attributed to India’s growth story. The difference this time is that the curve flattening is more decisive as volatility in term spread is significantly lower.
Ironically, the GDP numbers have defied the slowdown predicted by yield curve flattening; not only has there been no major plunge in growth, but the official guidance is also of an exponential bounce.
There is something amiss here; either the GDP numbers are out of whack, or the yield curve has lost its predictive mojo!!
Pieces of evidence we have been presenting over the past few years, prognosticating the fragility of household conditions, imply that it is the GDP numbers that are less dependable; the possibility of the yield curve being manipulated for such a long time is less likely. Indeed, our latest household tracker for the last quarter of 2024-25 coalescing multidimensional framework suggests an unrelenting slowdown.
Also Read: India’s Consumption Comeback Story Is Built On Shaky Ground
More From BasisPoint