.png)

Srijit Mishra is Professor, School of Economics, University of Hyderabad, and a member of the Technical Expert Group for the household income survey for India.
July 24, 2025 at 10:23 AM IST
India’s Gini Index, which is measured using household consumption data, has declined over the past decade. On the surface, this suggests a narrowing inequality gap, but the picture is partial. A closer look reveals how measures of inequality can sometimes obscure widening absolute gaps and this calls for a broad-based understanding.
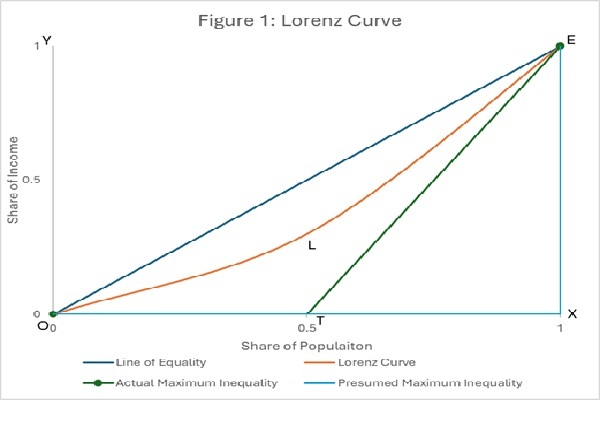
Let’s begin by understanding what the Gini Index really measures. The Lorenz curve (OLE, Figure 1) captures the income distribution within a population positing the cumulative share of income against the cumulative share of population, arranged from poorest to richest.
If everyone earns equally, we see a straight line of equality (OE). If one person holds all the income while the rest have none, inequality is total, and the curve hugs the axes (OXE), is a popular representation. However, OXE is not feasible, as it assumes that population is infinite. Hence, the ratio of the area of Lorenz curve (OLE) to the area below the line of equality (OXE), which is equivalent to the Gini coefficient, is an underestimate. To guard against this, I suggest a correction by taking the ratio of the area of the Lorenz curve (OLE) to the area of the actual total inequality (OTE), which when multiplied with hundred is the Gini Index.
For illustration, two individuals, J and K, with incomes of ₹1/- and ₹9/-, respectively, gives a Gini Index of 80, and not 40.
To ensure clarity in what the Gini truly captures, I propose the acronym TRANS for the five axioms that Gini satisfies:
Transfer sensitivity: A progressive transfer (from richer to poorer person without switching ranks) should reduce inequality. For instance, a transfer leading to incomes of ₹2/- for J and ₹8/- for K gives Gini Index of 60.
Replication invariance: Replicating the population with their incomes should not alter inequality. For instance, replicating population twice with incomes of ₹1/- each for both J and J’ and ₹9/- each for both K and K’ gives Gini Index of 80.
Anonymity: Interchanging incomes between individuals should not alter inequality.
Normalisation: Lower and upper bounds of an inequality measure should indicate perfect equality and perfect inequality, respectively. Incomes of ₹5/- for both J and K gives Gini Index of 0, and incomes of ₹0/- for J and ₹10/- for K gives Gini Index of 100.
Scale invariance: Converting money from one scale to another, that is from rupee to paise or by multiplying all incomes by a constant should not alter inequality. Incomes of 100 paise for J and 900 paise for K gives Gini Index of 80.
There are two axioms that the Gini does not satisfy. Hiatus sensitivity to level and Subgroup decomposable.
Hiatus sensitivity to level: At higher levels of income, the same or greater absolute income gap should increase inequality. Gini does not satisfy this. For instance, if incomes of both the poor and the rich individual rise tenfold to ₹10/- and ₹90/-, respectively, then the hiatus or absolute gap in income also increases tenfold from ₹8 to ₹80, but Gini Index remains unchanged at 80.
Subgroup decomposable: Inequality for a total population should be such that it can be easily broken down into weighted average of subgroup inequalities. The Gini does not satisfy this leading to analytical limitations. For instance, subgroup S1 with J and K having incomes of ₹1/- and ₹9/-, respectively, gives Gini Index of 80 and subgroup S2 with P, Q and R having incomes of ₹2/-, ₹3/- and ₹5, respectively, gives Gini Index of 30, but, when both the subgroups are combined with the five individuals together then it gives Gini Index of 47.5, not 50 (population weighted) or 55 (income weighted).
India’s Numbers
Comparing distribution of household consumption expenditure for India between 2011-12 and 2022-23 suggests that Gini Index has fallen from 29.8 to 28.0 in rural, and from 38.2 to 33.0 in urban. This was calculated after correcting for finite population with 12 fractiles (OT=0.95). World Bank estimates, based on unit-level consumption data, also point to a fall, from 28.8 to 25.5.
However, several caveats are in order.
First, caution must be exercised when comparing India with others, as the Gini Index for many countries is based on income data, while India’s is based on consumption expenditure. Second, India’s own survey methodology evolved: the 2022-23 survey had more items than in 2011-12, which complicates direct comparisons. Third, until recently, the World Bank’s portal listed India’s 2011 Gini at 35.4. It now shows 28.8. The reason for this revision remains unexplained.
And then there are the gaps. In constant 2011-12 prices, the absolute gap in monthly per capita consumption between the richest and poorest households for rural areas has grown from ₹3,960 to ₹4,858. In urban areas, the increase is from ₹9,581 to ₹10,229. Similarly, the rural-urban absolute gap widened from ₹1,200 to ₹1,502—a 25.2% jump in just over a decade.
Moreover, if we extrapolate consumption figures using projected population as of March 2023, the total household monthly expenditure sums up to ₹93.18 trillion. This is just 56.4% of the ₹165.28 trillion private final consumption expenditure for 2022-23 and 37.8% of the ₹246.47 trillion gross value added. When adjusted to constant prices, the proportions drop even further. In essence, consumption survey cannot and does not capture all aspects of consumption or income, making the Gini’s reach limited.
Another dimension, income and wealth, tells a more troubling story. The World Inequality Lab triangulates information from multiple sources. A working paper shows the top 1% of India’s earners command 22.6% of total income and a staggering 40.1% of national wealth. These are among the highest globally—and, for India, historically unprecedented.
Relative vs Absolute
The Gini index, despite its appeal and compliance with the TRANS axioms, remains a measure of relative inequality. It says nothing about how far apart the top and bottom really are. That distinction matters. A society where everyone becomes richer and even if the rich grow at a lower rate than the poor—as their base will be higher and as also is the case with India’s consumer expenditure data, a falling Gini can go hand in hand with an increase in absolute gaps. India’s current situation suggests precisely this.
Celebrating a lower Gini while ignoring widening gaps and those aspects that are beyond the realm of consumer expenditure survey can mask growing socio-economic stress, hide the persistence of structural inequality, and ultimately, come in the way of redistributive efforts.
To truly understand inequality, India must move beyond consumer expenditure and the relative comforts of the Gini.
The need of the hour is a richer suite of indicators, ones that factor in wealth, income concentration, hiatus sensitivity to level, and population substructures. Without this, any story of “bridging inequality” remains incomplete.
*Views are personal.
More From BasisPoint